A digital dashboard displays metrics related to web performance. Graphs show detailed statistics such as total clicks, total impressions, average click-through rate (CTR), and average position over time. The chart utilizes various colors to distinguish different data sets, and the interface features tabs labeled 'QUERIES', 'PAGES', 'COUNTRIES', 'DEVICES', and 'SEARCH APPEARANCE'.

Motivos

Visualize as causas comuns de correção e rejeição de formulários.

A small tool with a pointed, dark purple tip is centered against a plain light background. The handle is metallic, tapering down towards the tool's sharp end.
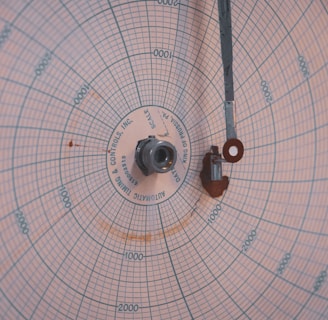
A circular chart paper with blue grid lines, marked with numerical data points and labels in a radial pattern. A central pivot with metallic components extends a thin arm across the chart. The markings indicate measurements in a systematic manner, featuring various numerical values.

Censo Visualização

Ferramenta para interpretar motivos de correção de formulários censitários.

A tablet screen displaying a financial chart with two lines, one red and one cyan, representing data trends over time. The background is dark with text showing figures at the top, including maximum, minimum values, and a percentage.
Motivos Comuns

Análise de causas de rejeição e atraso de envios.

A metal tool with a teal-colored handle and a textured grip. The handle is designed with ergonomic grooves and features a yellow stripe. Attached to the handle is a metallic bracket with two circular holes, likely for mounting purposes. The surface is shiny, suggesting a polished finish.
A laptop displays a detailed financial chart with lines showing data trends. In the background, a person is partially visible, wearing a dark shirt with the words 'most valuable' and some logos printed on it. The setting appears to be a modern workspace.
A complex scientific instrument, likely a mass spectrometer, is positioned in a laboratory setting with various probes and wires connected to it. The machine features the brand name Thermo Scientific, indicating its use in scientific research or analysis.
Análise Regional

Estudo sobre diversidade de representações e inconsistências regionais.

woman wearing yellow long-sleeved dress under white clouds and blue sky during daytime

A ferramenta é impressionante e realmente ajuda a entender as razões para correções e rejeições.

Carlos Silva

A laptop displaying a dashboard with various graphs, charts, and numeric data. The screen is partially visible, showcasing sections with line graphs, financial figures, and small images. The background is blurred with a prominent red light creating a warm ambiance.

Muito útil! A análise dos motivos trouxe clareza e facilita o trabalho com formulários censitários.

Maria Oliveira

A laptop displaying a line graph with various peaks and troughs on its screen, indicating stock or financial data. The graph and numbers are green against a black background. The laptop is placed on a wooden table, and beside it, a person's arm is partially visible.
★★★★★
★★★★★